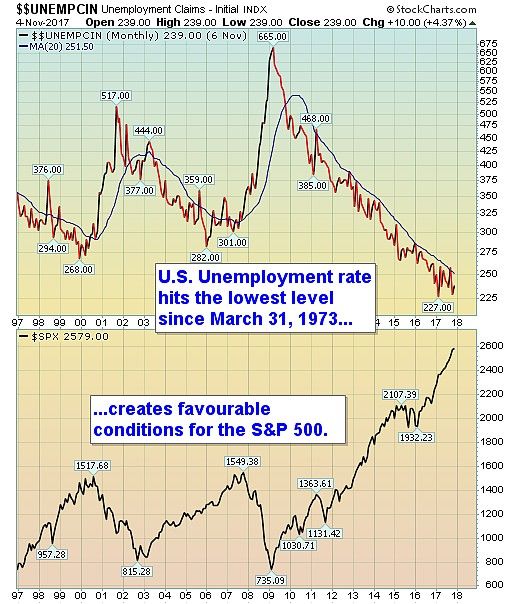
November 10, 2017: U.S. Unemployment rate reaches record lowThe U.S. Unemployment rate has just reached a level not seen in over forty years. In early November, the seasonally adjusted claims was 239,000. The 4-week moving average sat at 231,250 which is the lowest level since March 31, 1973 when it was 227,750. The main significance of a low number, apart from the positive outlook for the economy, is the stock market. The U.S. Unemployment rate and the S&P 500 have a tight opposite correlation. A declining unemployment rate has a positive affect on the stock market. The opposite is also true. When the stock market (S&P 500) begins to rollover, the reverse action from the U.S. Unemployment rate is not far behind. However, at present, both indexes show few signs of reversing their trends. Historically, the Unemployment rate first has a bottoming period of approximately six to nine months before it starts to rise. The stock market (S&P 500) also has a transition period of cresting, that is similar in duration to the U.S. Unemployment rate, before it starts to roll over. Bottom line: There are few signs from the S&P 500 that this impressive run from early 2016 has come to an end. And as the stock market leads the U.S. Unemployment rate, the probability of a reversal coming to the U.S. Unemployment rate over the next few months is low. The likelihood is that the Unemployment rate will find a floor at around 4.1% to 4.4% over the next few months. And the probability of a multi-month base developing bodes well for the S&P 500 into 2018. Donald W. Dony, FCSI, MFTA
|  |

|
| |
|
D.W. Dony and Associates
4973 Old West Saanich Rd.
Victoria, BC
V9E 2B2
|