March 14, 2019: Market Minute: Deflationary assets are outperformingDuring the current bull market, deflationary assets (industrials, technology, financials, communication, consumer discretionary and real estate) have greatly outperformed inflationary assets (commodities) for most of these past 10 years. Martin Pring's Deflation/Inflation Index (Chart 1) illustrates that deflationary assets have largely outperformed inflationary assets from late 2011 to the beginning of 2016 and again from mid-2018 to the present. During the period between Q1 2016 to Q2 2018, deflationary industries and inflationary sectors had near equal performance. The U.S dollar index plays an important role in determining the dominant performance of deflation or inflation. The US$, after a multi-year decline from a 2002 high, bottomed out in 2008 to 2013 and began to trend higher in the following years (Chart 2). The effect on commodities and inflation was quickly felt. During that time frame, the CRB fell over 60% and inflation eased off from almost 6.0% in 2008 to the current 1.5%. The low inflationary pressure and the strong U.S. dollar, are both key elements that aided a positive performing stock market. For example, the benchmark S&P 500 has gained almost 300% from the lows in early 2009. The Dow has also racked-up an impressive run with nearly a 275% gain. And NASDAQ has posted over a 400% return from the drop in 2009. The key take-a-way is that those indexes hold predominately deflationary assets. Bottom line: Deflationary assets and indexes have greatly outperformed over inflationary assets (commodities) since the start of the bull market in early 2009. Much of the credit can be attributed to the rising U.S. dollar index. The outlook for the rest of 2019 is for a continued dominance in deflationary sectors such as industrials, technology, financials, consumer products and real estate over inflationary assets (energy, precious metals, agriculture and base metals). This expected strength is also bullish for the markets and the US$. Our models are pointing to 3000 for the S&P 500 and a return to par for the U.S. dollar index. | 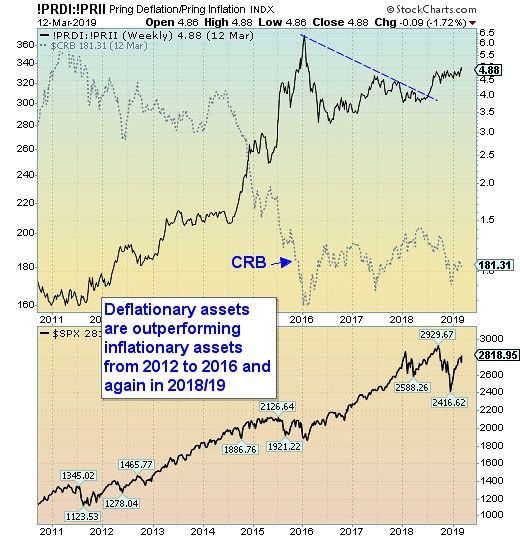 .jpg) |

|
| |
|
D.W. Dony and Associates
4973 Old West Saanich Rd.
Victoria, BC
V9E 2B2
|