July 12, 2019: U.S Bond yields point to a 40+% rise in the S&P 500.Over the last 10 years, the yields on the benchmark U.S. 10 year Treasury bond have foretold the path of the S&P 500. Money flow trends between the bond market and the equity market, over the past decade, have given investors a heads-up on the trading direction of the S&P 500. The swings toward fixed income (2011 to mid-2012, 2014 to mid-2016, Q4 2018 to mid-2019) have produced higher bond prices and lower yields as money managers balance safety and risk. The results play out on the S&P 500 with flat contained performance. During more bullish times, managers sell bonds, increasing their yields, and buy more equities (risk) with the resulting rally in stocks (Chart 1). From mid-2012 to early 2014 and from mid-2016 to late 2018, the S&P 500 soared on average over 45 percent in about 18 months! In chart 2, the price action for the S&P 500 now appears to be to breaking out once more. The benchmark equity index has broken above the twice tested resistance level of 2930-2945 range and gone to a new all-time high of 3000. Bottom line: The movement between bonds (safety) and equities (risk) over the last decade can provide considerable information to investors of what kind of price action is likely going to develop. With a decline in yields (and a rise in bond prices), investors should expect a flat range-bound stock market. However, when yields are rising (and bond prices are falling), investors should expect more favourable conditions for equity markets. At present, the S&P 500 has broken out of a multi-month consolidation and has now printed a new all-time high. This suggests that bond yields will start to rise and bond prices will decline. If past performance is a guide, we would expect a sizable advance from the S&P 500 over the next 18 to 24 months. | 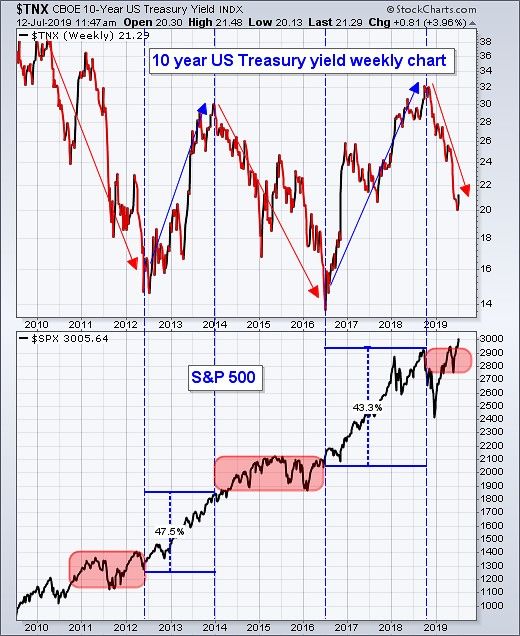 .jpg) |

|
| |
|
D.W. Dony and Associates
4973 Old West Saanich Rd.
Victoria, BC
V9E 2B2
|