September 15, 2019: Is the bull market nearing an end?The current bull market has advanced for 10 years. Is it near the end of its run? How much more upside is left? This is a question that we receive from investors at an increasing rate over the last couple of years. Our answer is not definitive, but is based on long-term models that continually illustrate the same approximate conclusion. Our first model is constructed on 130+ years of data. It is based on the relative performance between deflationary assets (Dow Jones Industrial Average) verses inflationary assets (Commodity Research Bureau), or the Dow verses the CRB. The main takeaway is that the two opposing indexes create a relatively stable pattern, particularly from 1905 onward. They alternate in dominate performance on an average 18 year cycle (Chart 1). Since the 1930s, that repeating pattern appears to have solidified even more. The last two bull markets (Dow outperforming the CRB) have been 18 to 20 years and the last three periods when the CRB outperformed the Dow have averaged 14 years. This current bull market start in 2010. Following past patterns, this would suggest the market has approximately another nine years. U.S. Unemployment Rate and the Dow is a great indicator of bull or bear markets. These two indexes move in opposite directions. Though the Unemployment Rate lags behind the stock market by a few months, at present, there is no indication of either index rolling over and trying to move toward the other (Chart 2). And finally, the movement between safety (bonds) and risk (stocks) is another time-tested indicator of strength or weakness in the market. During periods of economic uncertainty, fund managers pare back their risk positions with fixed income. The last three periods of ambiguity were 2011-2012, 2014-2016 and most recently in late 2018-2019 (Chart 3). Bottom line: The concern for many investors is that the bull market is long in the tooth and a major correction (new bear market) is due. We have tried to show that the overwhelming evidence points to the opposite. In Chart 1, the probability that the market is currently repeating a similar pattern that it has forged over the last 130+ years outweighs any new formation. In Chart 2, the well defined opposite correlation between the Dow and the U.S. Unemployment Rate shows that neither index is starting to migrate toward each other, which would signal a new bear market. And finally (Chart 3), the market's movement toward safety (bonds) and away from risk (stocks). This recent action toward bonds and out of stocks appears to be completing, though more time is still needed to show that investors are moving back to risk. | 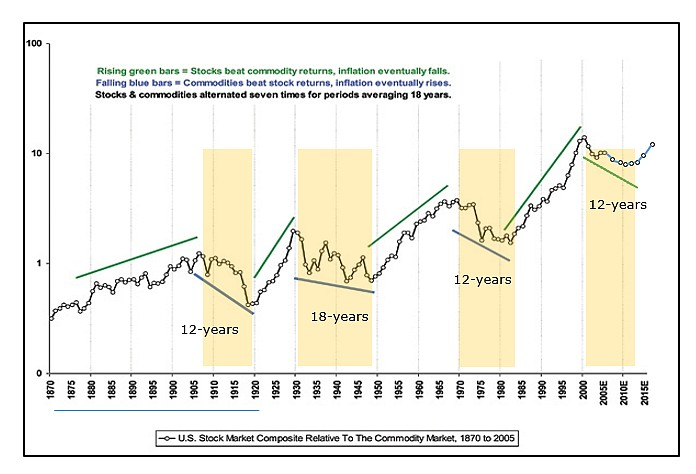 .jpg) 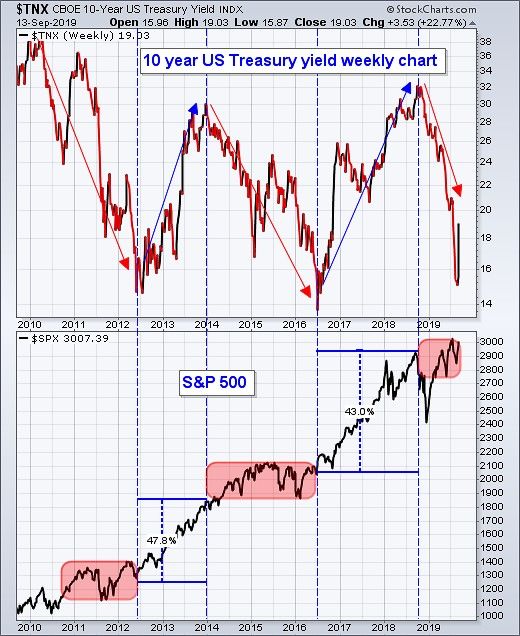 |

|
| |
|
D.W. Dony and Associates
4973 Old West Saanich Rd.
Victoria, BC
V9E 2B2
|