March 14, 2024: Estimating the bull market's durationIn previous articles, we have discussed the potential duration of the current bull market run. As 2024 marks the start of the 15th year of the movement, we are reviewing the evidence again. Chart 1 is a long-term 135 year illustration of the relative strength performance of the Dow Jones Industrial Average verses the Commodity Research Bureau Index (CRB). What the data clearly shows is that there is a fairly well structured cycle. The last two bull markets ( 1950-1970 and 1982-2000) were 18 to 20 years. The cycle previous to those two patterns was only 10 years (1919-1929). The average duration of the three is 16 years. More weighting is applied to the most recent bull markets giving the length of the movement to about 18 years. Chart 2 is a 3-year rolling price return on the S&P 500 from 1974 to present. This shows that peaks are at the 100% return level. These peaks are normally 'blow-off' tops marked with excessive and sustained levels of optimism and greed. The present reading is no where near the extreme level of 100%. The current level is at the average percentage of about 29%. Past advances to the peak level of 100% typically take one to three years to achieve. Chart 3 outlines the Business Cycle and the sectors that perform the best and the worst at the different stages. In the Expansion phase, the financials, technology and communication services sectors should be outperforming the S&P 500. All three industry groups are outperforming the benchmark equity index. Bottom line: The three charts all point in the same direction. The bull market advance has likely more upside movement over the next few years. Chart 1 suggests there is about three more years. Chart 2 outlines the S&P 500 is mid-range and could take one to three more years to achieve a peak. And Chart 3 of sector performance clearly emphases that the market is still in the Expansion stage. | 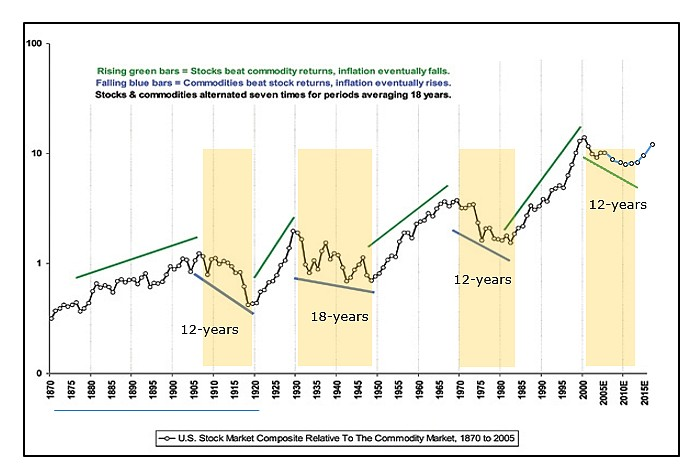 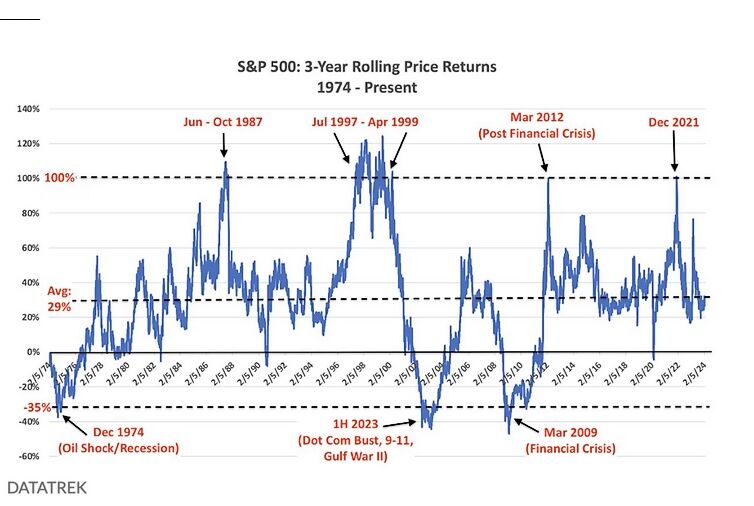 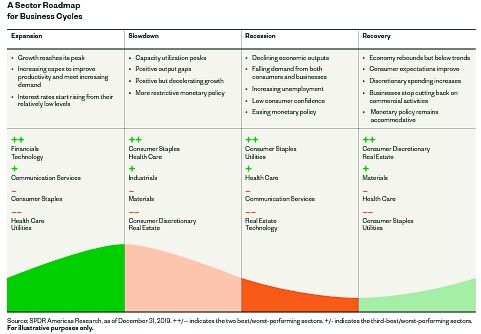 |

|
| |
|
D.W. Dony and Associates
4973 Old West Saanich Rd.
Victoria, BC
V9E 2B2
|